Falling Bitcoin Exchange Flows Signal Growing Market Fragility: Analyst Warning

Bitcoin's price has remained relatively calm in mid-December 2025, trading in a tight range around $90,000 after retreating from its October all-time high near $126,000. However, on-chain data reveals a concerning trend: declining inter-exchange flows are eroding internal liquidity, making the market more vulnerable to sharp, unpredictable moves—even without aggressive selling.

Key Summary
- Declining inter-exchange flows are reducing liquidity, increasing slippage and volatility risk.
- Exchange balances remain near historic lows, offering limited cushion against sudden trades.
- Derivatives metrics indicate a healthy de-leveraging rather than panic, but the overall structure remains fragile.
- Long-term fundamentals (institutional adoption, halving supply dynamics) stay supportive, yet short-term risks dominate.
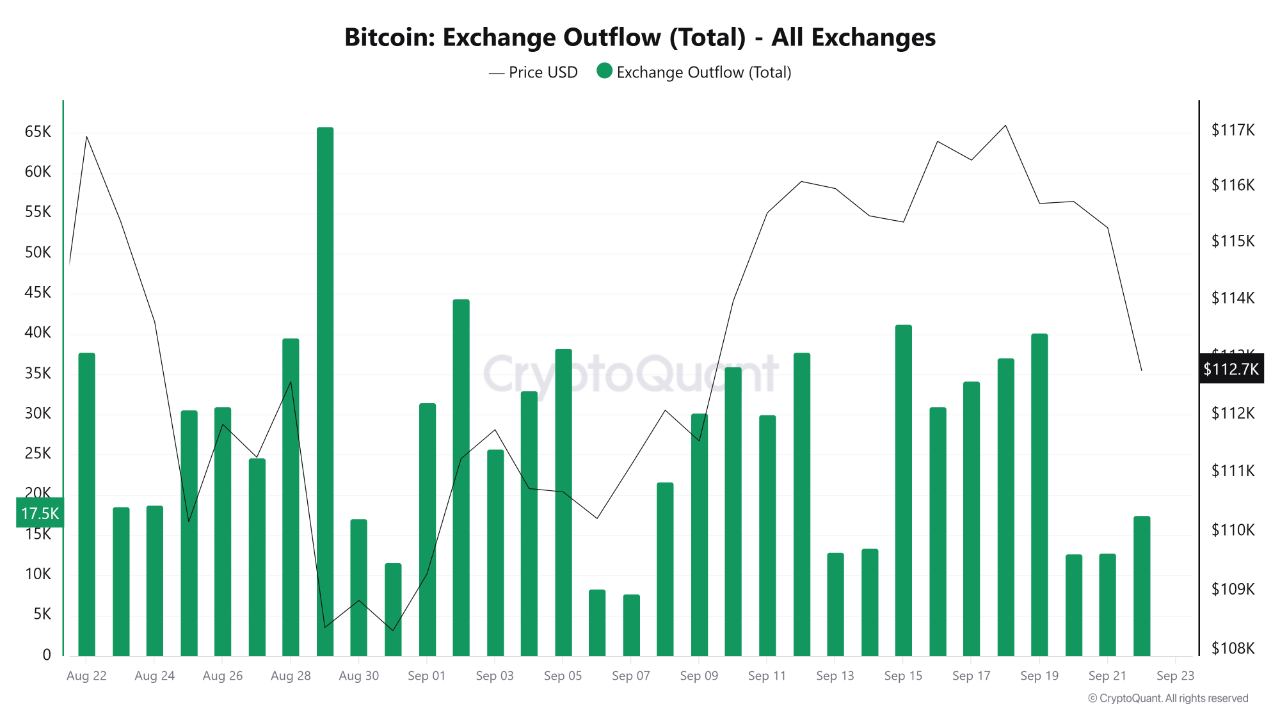
Exchange Liquidity Is Drying Up
Since early December 2025, Bitcoin has consolidated between approximately $80,000 and $94,000. While this range-bound action appears stable on the surface, CryptoQuant contributor XWIN Research Japan highlights a sharp slowdown in Bitcoin movements between exchanges.
The Inter-Exchange Flow Pulse (IFP) — a key CryptoQuant metric tracking capital circulation across platforms—has turned bearish (red zone). When flows are high, arbitrage keeps order books deep and prices stable. Low flows thin out liquidity, amplifying the impact of even modest orders.
This vulnerability is compounded by Bitcoin's exchange balances hovering near multi-year lows. Low balances historically reduce immediate sell pressure in quiet markets but leave little supply to absorb large buys or sells.
Get more insights
Weekly highlights, deeper research notes, and market alerts.
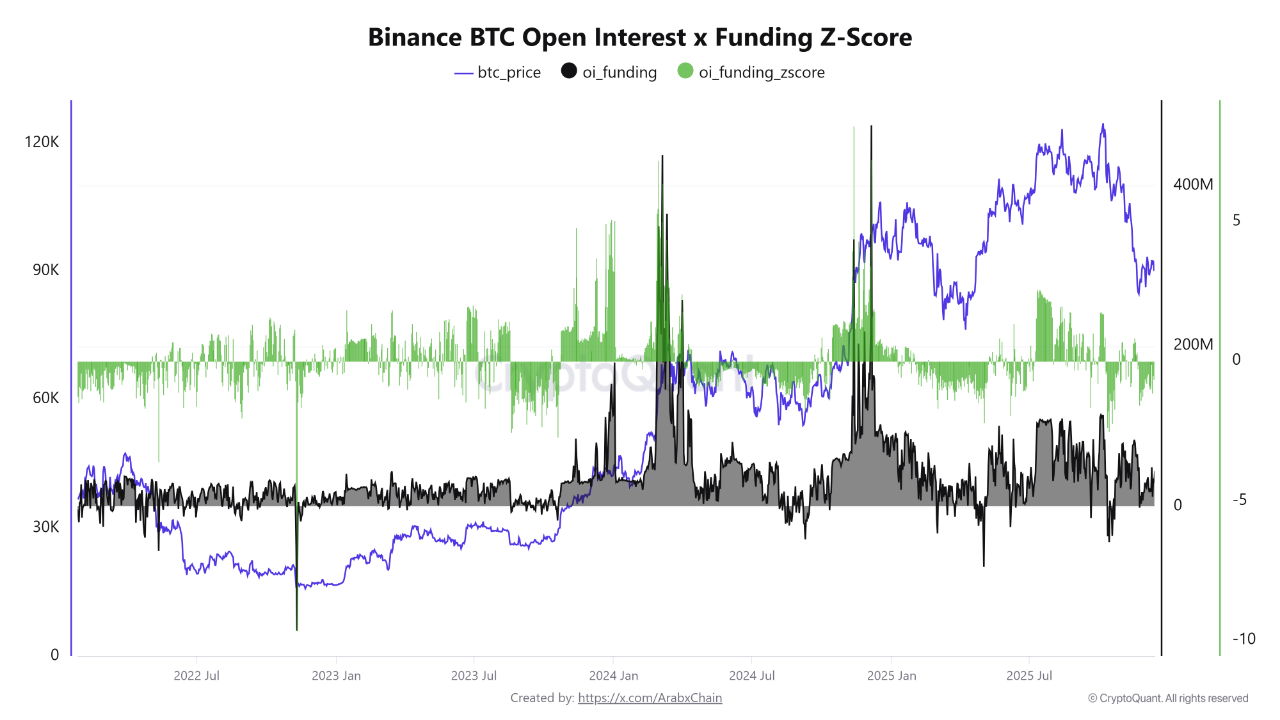
Derivatives Show a Controlled Reset, Not Collapse
Data from CryptoQuant contributor Arab Chain supports the view of a cooling rather than crashing market. The combined open interest and funding rate Z-score on Binance perpetuals stands at approximately -0.28—slightly below the historical average.
A negative Z-score signals traders are unwinding excessive leverage rather than adding new speculative positions. This contrasts with overheated rallies, where sharply positive Z-scores often precede sharp corrections.
Historical Context: How Low Flows Have Impacted Past Cycles
| Period | Inter-Exchange Flow Pulse Trend | Bitcoin Price Behavior | Outcome |
|---|---|---|---|
| Late 2021 (Bull Peak) | High → Declining | $69K ATH → 50%+ drawdown | High leverage + low liquidity amplified crash |
| Mid-2022 (Bear Market) | Persistently Low | $17K–$25K range-bound | Thin books caused frequent 10–20% swings |
| Late 2024–Early 2025 | Rising → Peak | $126K ATH in Oct 2025 | Strong flows supported rally |
| Dec 2025 (Current) | Sharp Decline (Red Zone) | $80K–$94K consolidation | Increased fragility; risk of outsized moves |
Low inter-exchange flows have historically preceded periods of heightened volatility, even in otherwise healthy bull markets.
Analytical Takeaway
The current setup is not a bearish reversal but a structural warning. With leverage being responsibly reduced and no widespread panic selling, the market is undergoing a healthy reset. However, until inter-exchange flows recover and order books thicken, Bitcoin remains prone to sudden spikes or drops.
Long-term bulls can view this as a healthy pause before the next leg up, driven by ongoing institutional inflows and post-halving supply tightness. Short-term traders should exercise caution, as low liquidity can turn small catalysts into large price swings.
As of December 19, 2025, Bitcoin trades around $90,000, with the next key levels to watch being $94,000 resistance and $80,000 support.
Related articles